WordPress is such an amazing content management system! It offers many professional tools, both free and premium, packed with some strong features that will assist you in creating excellent websites.
Because of the incredible number of existing plugins which can be added to your WordPress site, it’s so easy to increase your online business performance, even if you don’t have an extensive coding knowledge.
In this article, you can find various plugins that can be used specifically for data visualizations. These can be very useful for creating charts (line, bar, area, pie, geo, etc.), tables, and more. After creating these interactive elements, you can include them into your posts. You can easily insert your data and visualize it on any device.
Browse through all of these 20 data visualization WordPress plugins and download the ones that can help you improve your website’s performance.
WordPress Charts and Graphs Lite
This is a useful WordPress chart which can be used to create various charts types: bar, area, column, pie, chart, line, and more. line, bar, area, column, and geo charts. This can become a powerful tool and help you achieve your goals. You can also create animated charts and diagrams for a fully visual effect!

WordPress Charts
Use this excellent WordPress plugin to rapidly create wonderful HTML5 charts. This item lets you customize your charts and you have 6 types to choose from. All of them are really easy to edit and animate to fulfill all your desired results. This plugin looks great even on Retina displays!

Responsive Mortgage Calculator
This is a very useful mortgage calculator plugin that you can add to your WordPress website. This is a simple widget and shortcode that is compatible with any theme. You can also add it at any size and on any device. Users only need to enter a couple of requested information and they’ll be able to calculate their mortgage in seconds!

Map Visualizer
Use this excellent WordPress plugin to insert your information from CSV files and to visualize them on Google maps. After the import, you can already visualize your map. If it sounds too difficult, you can find all the information and advice you need on their page. See what it has to offer!

Gravity Forms Charts Reports
Take a look at this neat WordPress plugin that you can use to create wonderful charts. These HTML5 charts can be created by using your data and a simple shortcode. They’ve now become Maxicharts but they’re just as simple as before! You can check out the instruction before proceeding to the install, just to make sure you’re on the right path!

Data Tables Generator
Here is an excellent WordPress plugin that can be used to generate data tables. You can customize their design and other features. It requires no coding and it supports formulas. You can easily change the colors of the text and cells to create your desired look. See what it can do for you.

Snowball
Snowball is a great WordPress plugin that helps you visualize your data in a better way. This plugin is very useful for journalists and bloggers who want to create modern, catchy articles. This plugin allows you to create your article one content block at a time. Besides text, you can also insert images, videos, widgets and more!

Calculated Fields Form
Check out this useful WordPress plugin that lets you create interactive forms. You can organize your data based on date, percentages, price, etc. You can calculate lots of different things such as finance, quote, booking costs and more! You can also start creating by using their predefined form templates.

DrawIt
DrawIt is a neat WordPress plugin which you can use to create and edit charts, diagrams, etc. There are multiple ways to which you can add a diagram, you just need to choose the one that fits you and your website best! Take a look at what it has to offer and use it on your websites.

Infogram
Infogram is another great WordPress plugin that gives you all the necessary tools to create data visualizations. These interactive items have responsive designs which fit any screen. This plugin lets you create animated graphs, charts, and reports. You don’t need to have any coding skills – it’s simple like that!

Factmint Charts
Here is another excellent WordPress plugin that you can use for data visualization. This useful item can be used to create various charts. You can also a list of shortcodes to create your charts, which you can find on their website. They’re really easy to use and the instructions are always there to help you.

TransitArt
TransitArt helps you create and manage data visualization on your website or mobile application. Take a look at what it has to offer and use it in your projects. With this plugin, you can easily publish different public transport timetables. You can choose to present your data as a timetable or even as a journey planner.

Blazing Charts
Check out this useful WordPress plugin that lets you easily create and manage interactive charts. This great item has many neat features. This plugin is not that hard to use and you also have instructions to help you along the way!

TablePress
Here you have a great WordPress plugin that you can use to create tables into posts, content pages, widgets, etc. without writing any code lines. You can also embed the tables you created into posts, widget or pages using the provided Shortcodes. Your tables can contain any kind of data you want, including formulas. Get creative!

POWr Graph
Here is another useful WordPress plugin that you can use for data visualization. This cloud-based plugin helps you easily create customized charts. You just need to download, install, activate it and then start creating by dropping the plugin anywhere on your theme.

Venngage Infographics
This is an excellent WordPress plugin that gives you all the tools to rapidly build infographics, charts and other data visualizations. You can then rapidly insert them into your WordPress site. You can easily embed or publish what you’re working on without having to leave your edit screen. You can always preview your edit and autoscale your infographics. Try it and see for yourself!

WP Beautiful Charts
This is a great WordPress plugin that can be used to easily create customized charts. You can then insert them into your websites, blogs or mobile applications. They’re very simple but effective and they can help you reach your goal or send the right message to your audience!

M Chart
This is another useful WordPress plugin that lets you rapidly build and manage display charts which you can then insert into your website via shortcodes. This plugin uses a spreadsheet interface in which you can manage the data that’s gonna be presented as a chart afterward. Use the instructions to make sure you’re on the right path.
WordPress Charts and Graphs
Here is a simple but powerful WordPress plugin that helps you easily create data visualization tools. You can build in just a few easy steps customized charts that you can then add to your website. You can also create interactive charts and tables that will make your WordPress website stand out from the crowd. You can choose between 9 chart types.

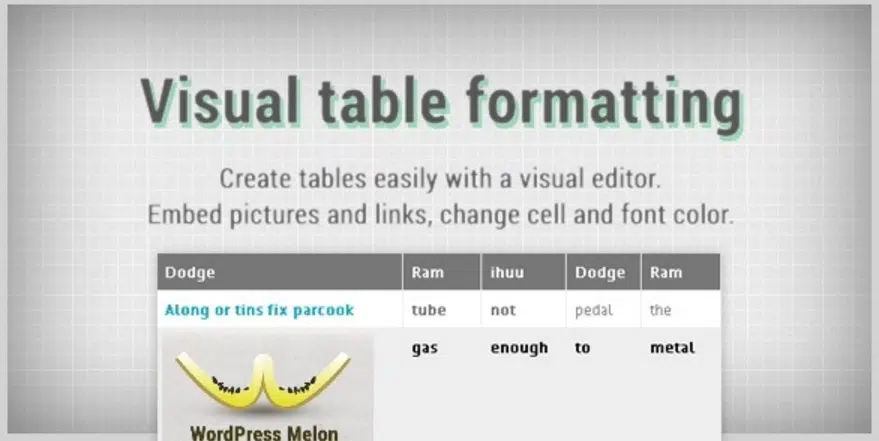
Visual Table Formatting
This is an excellent WordPress plugin which has the following features: easy to use interface, no coding skills needed, customized features, and more. You can use it to create useful, colorful tables in a very easy way. By using the visual editor you can add, edit and change cells from your table. Best of all, it doesn’t require any coding skills!