Data visualization is the modern equivalent of visual communication and involves the creation and study of the visual representation of data. It transforms information in an abstract, schematic and visual form.
Data visualization’s goal is to communicate information clearly and efficiently, and this is done via charts, graphs, plots etc. These use dots, lines, or bars, to visually communicate a message.
Learn how to create simple, clean and engaging HTML5 based, CSS jQuery charts. By analyzing, using and following the tutorials and scripts in the list below, you will learn how to create meaningful charts from any data, in a way that provides the appropriate amount of details while still keeping an eye on the big picture and making the information appear in a user-friendly way.
There are many jQuery charts plugins available that can help you create interactive data visualizations. In this list, you will find some of them, plus a bunch of awesome CSS jQuery charts and graphs scripts.
By using these CSS jQuery charts and graphs scripts and tutorials, plus some great and useful plugins, you won’t waste time and effort and you’ll be able to create data visualizations quickly and beautifully.
CSS3 Pie Chart
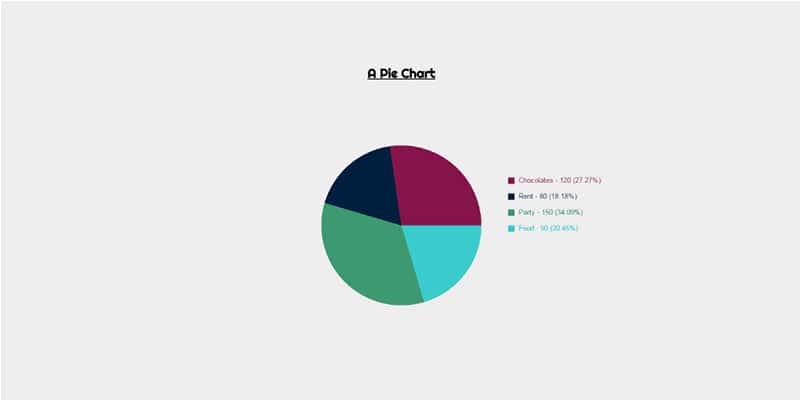
Learn how to make this CSS3 pie chart that uses multiple colors and feel free to use it in your own projects. Codes are provided.
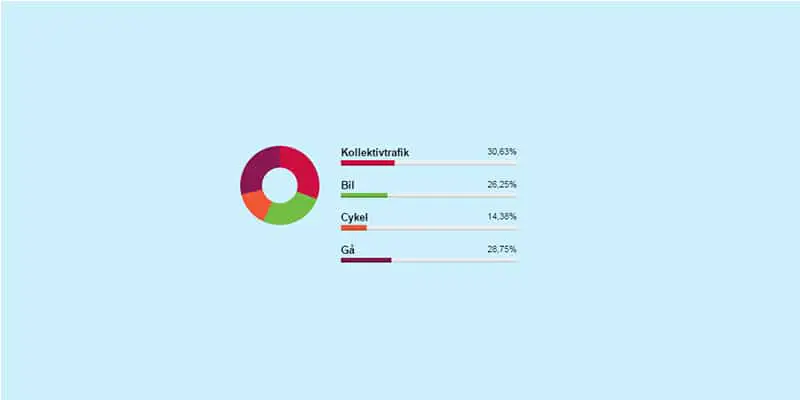
Customisable Animated Donut Chart
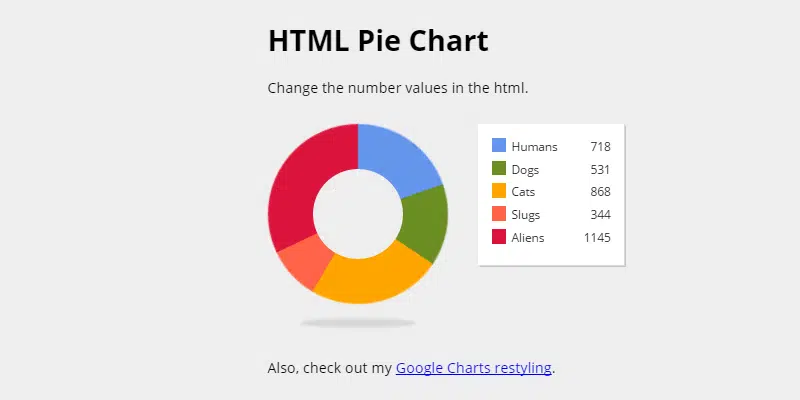
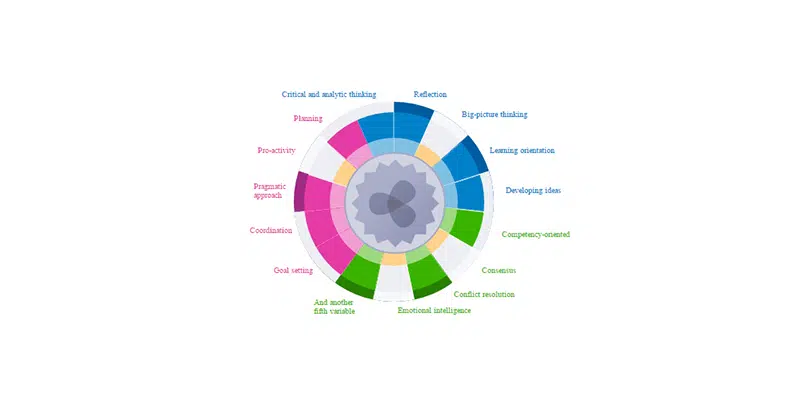
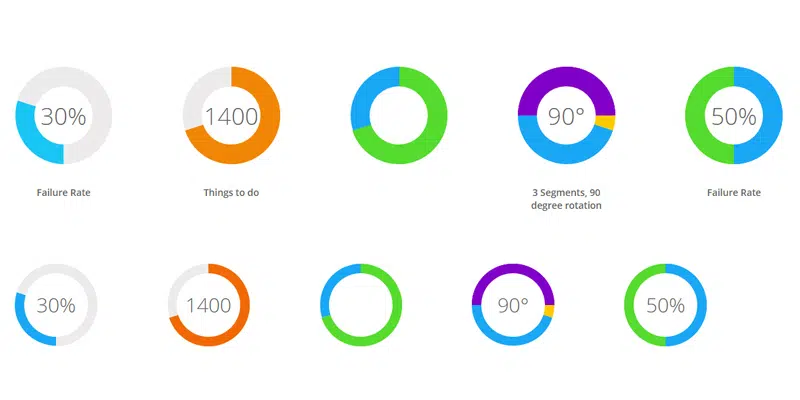
You can now create a clean and minimalist animated chart that’s also fully customizable. This animated donut chart can be very effective in regards to data representation so make sure to closely follow the codes provided by this web developer.
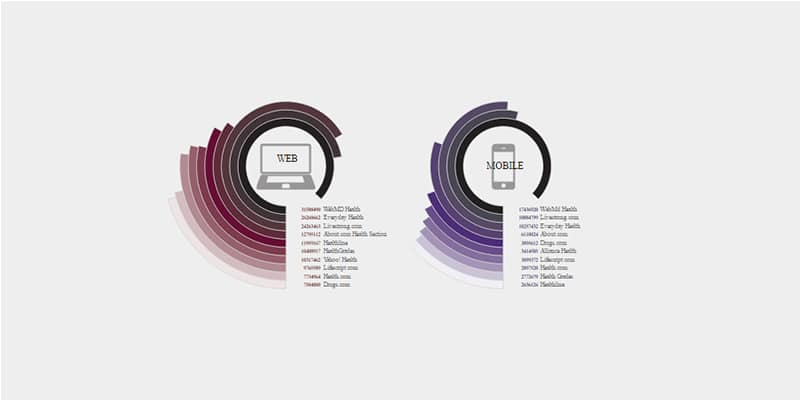
Circle Bar Chart
This is a nice, circle bar chart with a gradient effect that will grab your attention. In this link, you can learn how to make it yourself, by analyzing this web developer’s codes.
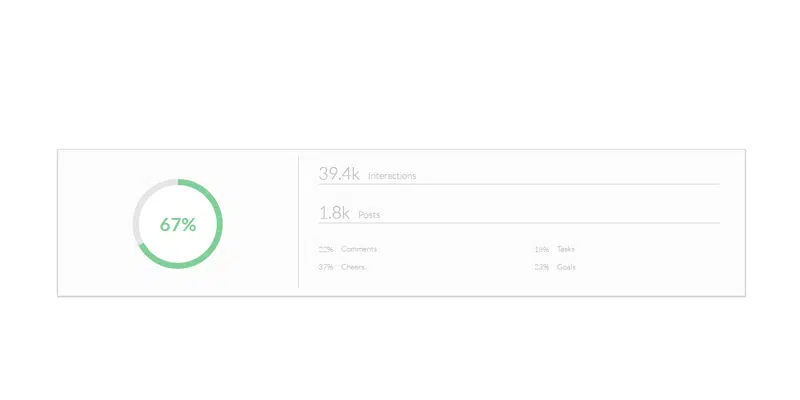
Dash Board Chart
Get the HTML, CSS and JS codes for this dashboard chart that has a beautiful design and see how you can integrate it in your project.
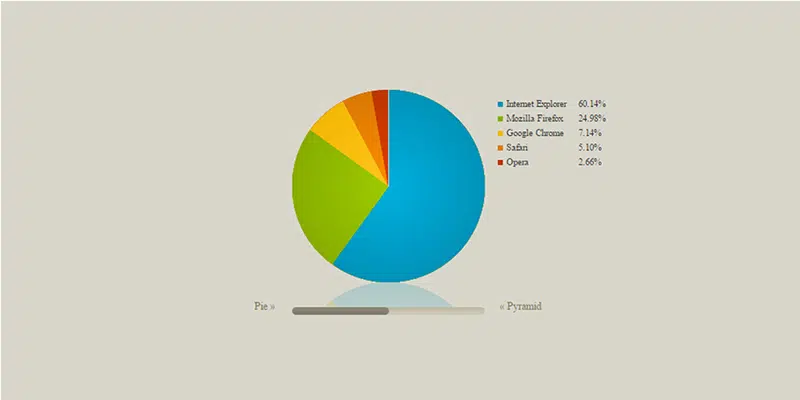
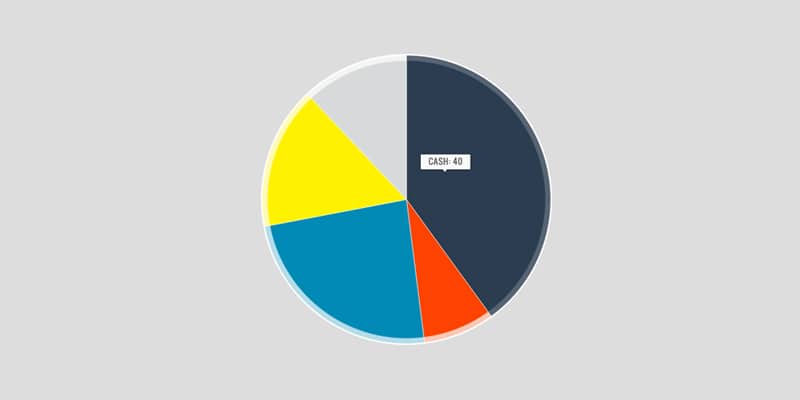
SVG Pie chart with tooltip and mouse effects
Make this SVG Pie chart with tooltip and mouse effects yourself, for your own projects, by using these codes. This pie chart has a minimal and effective design.
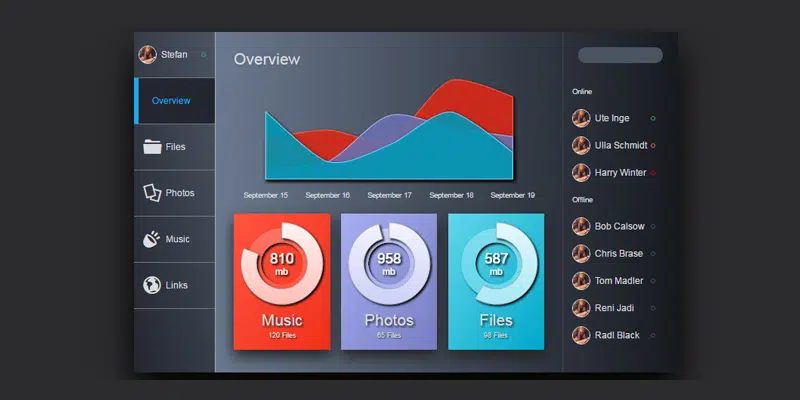
Cloud storage UI
This is a complex cloud storage user interface. It comes with a menu containing Files, Photos, Music and Links tabs, plus some other beautiful CSS jQuery charts and graphs which you will want to learn how to code immediately.
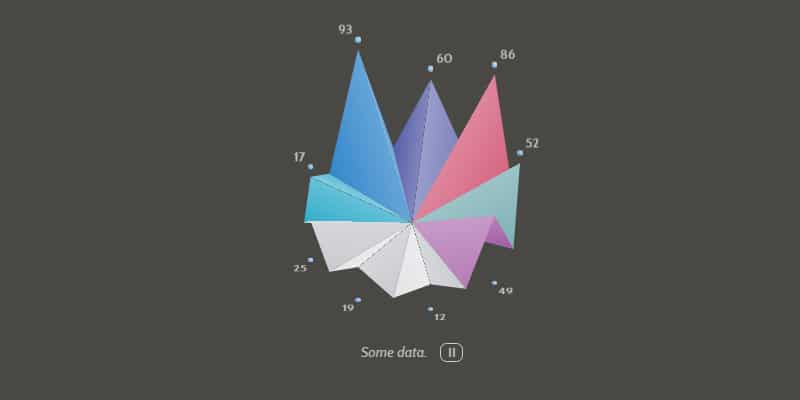
CSS 3D Animated Chart
This is a unique-looking 3D CSS animated charts with beautiful effects and design. The good news is that you can get the codes for free!
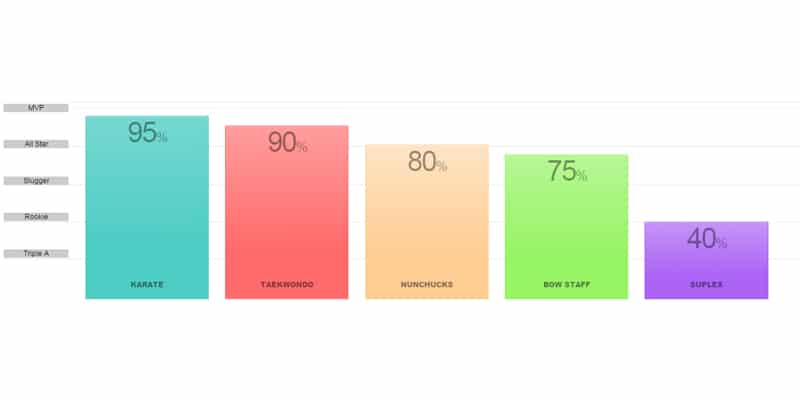
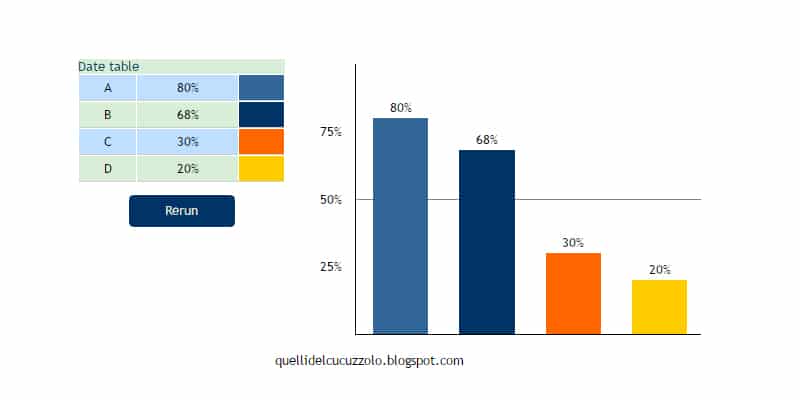
Responsive CSS Bar Graph
This is an easy to make, responsive CSS bar graph with multiple colors that will look great on every device. In this link, you can learn how to make it and fully customize it to your needs.
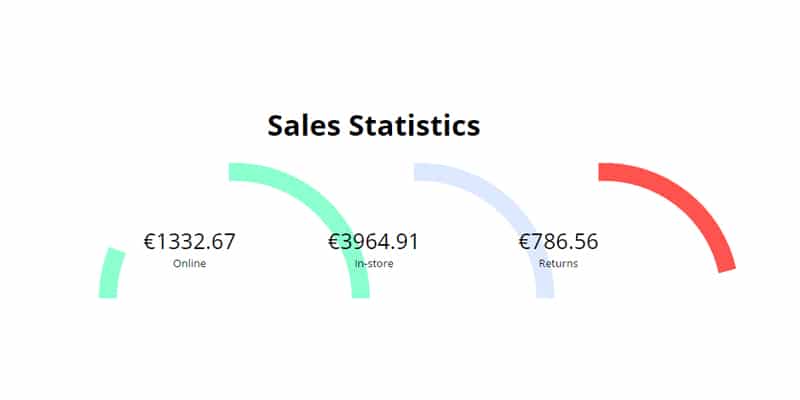
SVG Doughnut chart with animation and tooltip
This is a simple SVG Doughnut chart with animation and tooltip which can be integrated into all sorts of web projects. Codes are provided in the link above.
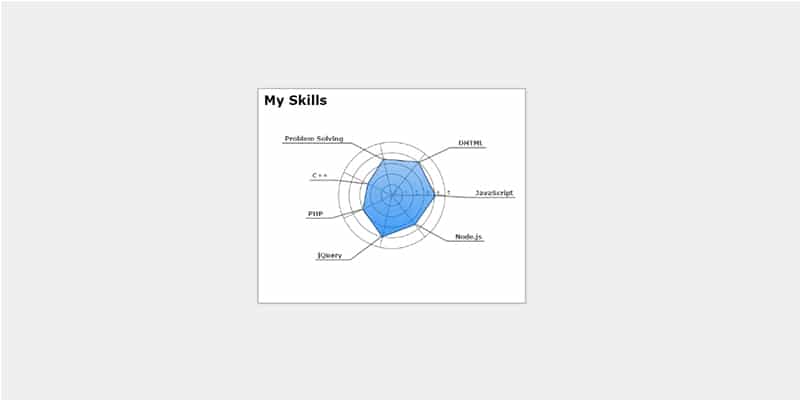
Radar Chart jQuery Plugin
This is a basic, radar chart jQuery plugin with subtle animations that will present data in a clean way. Get it for free.
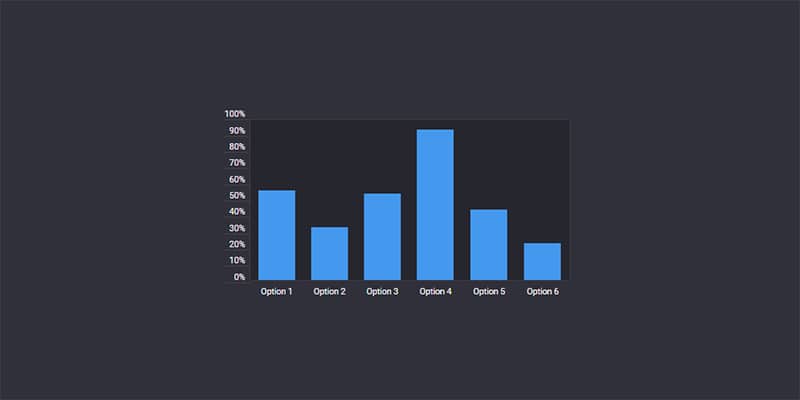
Animated bar chart
Learn how to create a simple bar chart for your web project and animate it using CSS and jQuery!
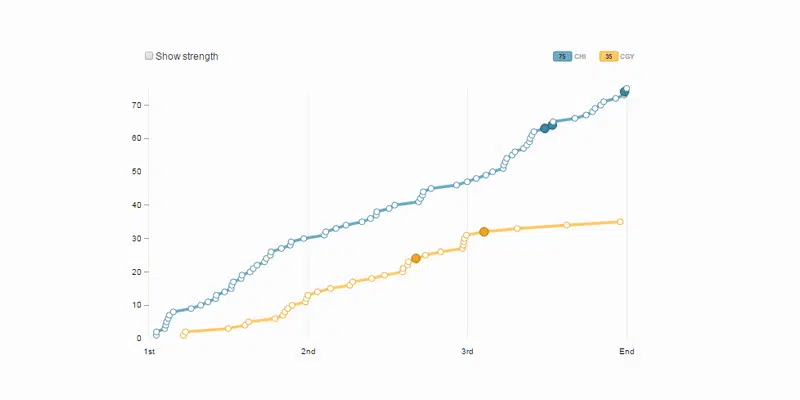
D3 Line Chart Plotting Shot Attempts
Create this beautiful and simple chart based on the codes provided and learn how to code it yourself.
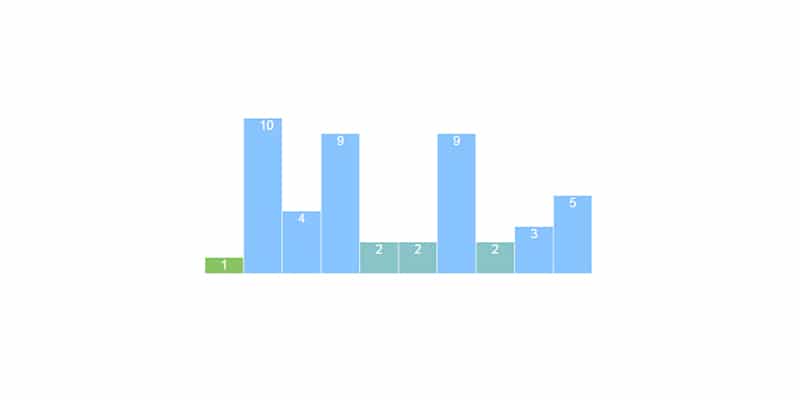
Bar Chart with JS
This is a simple blue and green bar chart made with JS, HTML, and CSS which you can learn how to make it yourself.
HTML Graphs with Horizontal Bar Chart
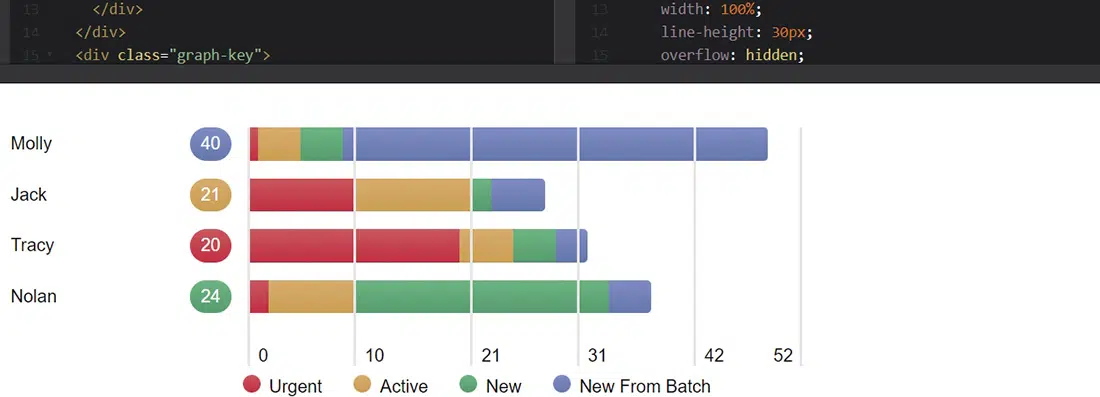
This was an attempt to make a really nice graphical representation using only HTML elements. This is a horizontal bar chart that comes along with its code. From this study, the programmer learned how to develop a model system based on SVG.
D3.js bar chart with transitions
This is a D3.js bar chart with transitions that were made with HTML, CSS and some jQuery as well. You can get the codes and customize them to best fit your projects.
Canvas pie chart with CSS bar chart fallback
This is a canvas pie chart with CSS bar chart fallback that has a simple and friendly design. It is nicely animated and you can get the codes to customize it for your needs.
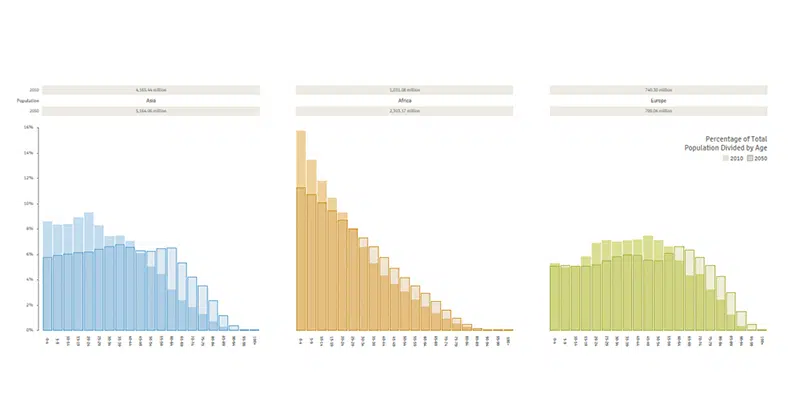
Multiple Chart Example
Learn how to make simple charts with this cool code provided by this web developer. You can now easily learn how to create multiple charts.
Animated chart with jQuery
This is a simple animated chart made with jQuery, HTML, and CSS. Get the codes and learn how to make it yourself.
Create an Interactive Graph using CSS3 & jQuery
In this tutorial, you will code an Interactive Graph using jQuery and CSS3. You will learn how to use jQuery’s popular plotting plugin called “Flot”. Flot is a pure JS plotting library for jQuery.
Canvas PieChart
Create a simple, but effective and nicely animated canvas pie chart and see in how many ways you can integrate it in your projects for better data visualizing. Get the codes and learn how to make it yourself.
CSS Vertical Chart
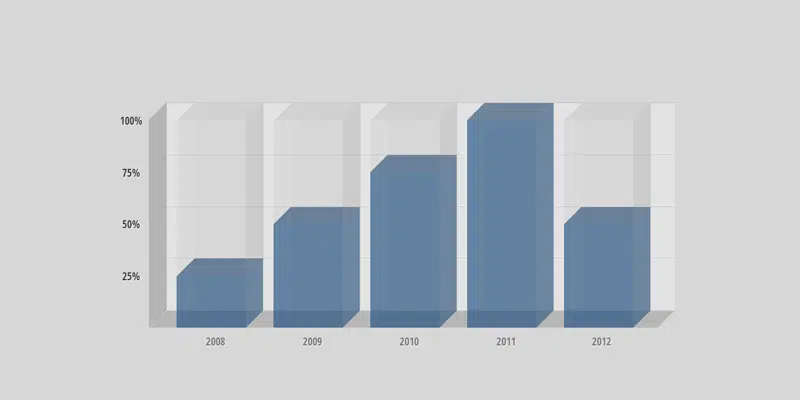
This is a CSS vertical chart with a nice 3D effect. The code will teach you how to create the shadows, shapes and all the details.
Responsive SVG graph
This is a responsive SVG graph that remains undistorted as it resizes based on the device’s window size. In this link, you will also find the code that can be implemented into your own web project.
Adjustable Pie Chart
Create an adjustable pie chart for yourself by following and analyzing these useful codes.
Animated Stats and graph
This is a nice and animated stats and graph code that you can use with confidence. This example is really nice and it would look great in your web design projects. It can show how many hours you have worked.
CSS3 Animated Graph
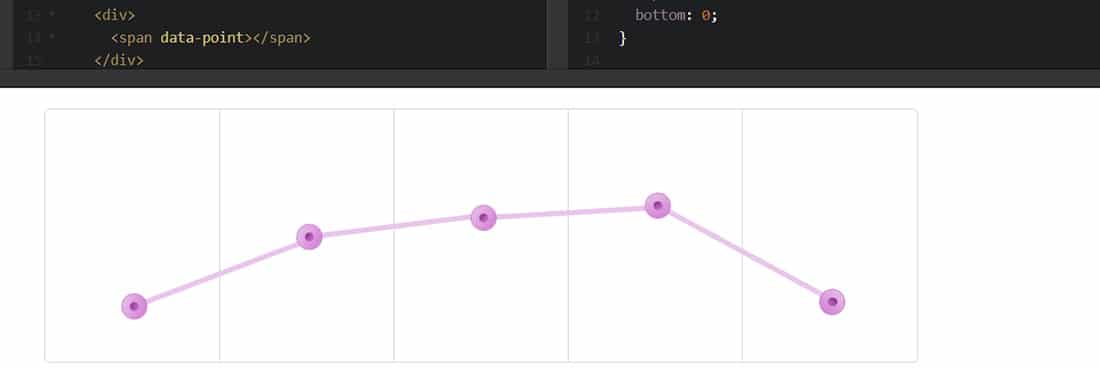
This animated CSS3 graph looks really nice and so will your project if you decide to use it. This is a pure HTML and CSS3 line graph. It has an effective design that highlights a section with a caption. It is populated and updated on an interval with Angular JS. To connect the dots a rotation transform was manually applied and the animation is provided by a simple CSS3 transition.
Make Google Charts Responsive
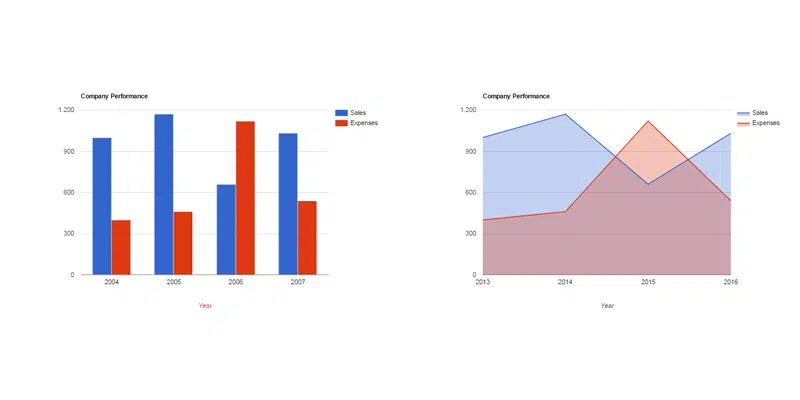
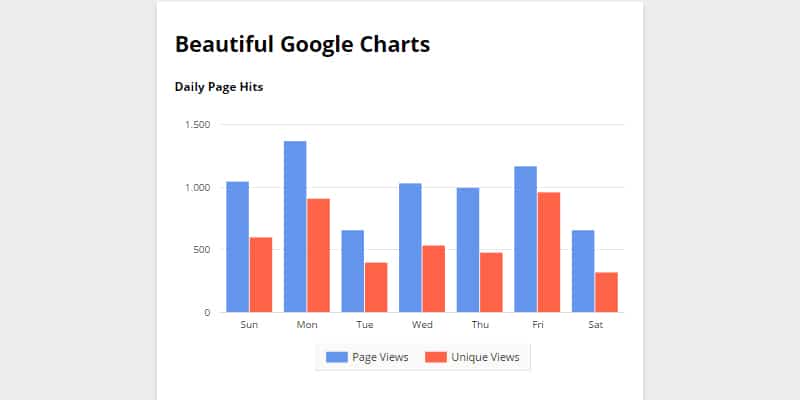
In this tutorial, you will learn how to make Google Charts responsive that will look great across all browsers and devices, with this great code tutorial. The results will be compelling and they will improve your chart designing skills.
Dynamic Line Graph w/ Raphael.js
This is an animated dynamic line graph that uses a custom data object. This example can come in really handy and it also provides all the code needed to implement it in your web project. There are many dynamic charts you can find on the internet but none as customizable as this one. This example is filled with all the features that you actually need.
Dashboard Graph
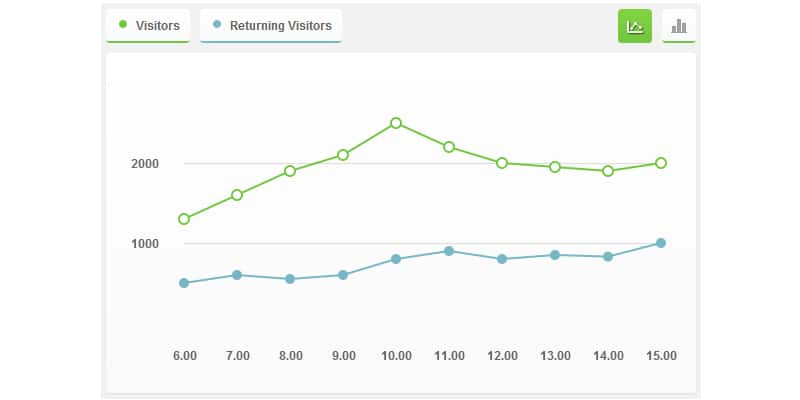
This is an early concept graph for an admin dashboard and it looks great. This example can be a great source of inspiration and it can also improve your coding skills thanks to the code provided in the link. You can easily toggle between the team’s overview and individual user data. Each value is calculated based on the existing data and markers are adjusted accordingly.
Line Chart with Chart.js
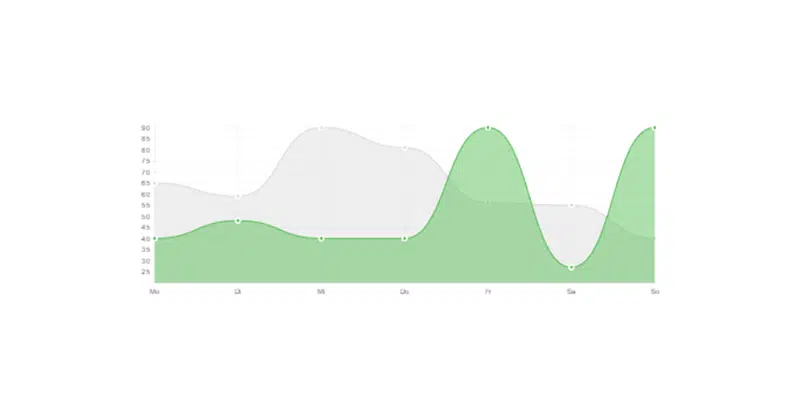
Learn how to create this simple and modern line chart with Chart.js and add it to your project.
JS Pie Chart V2
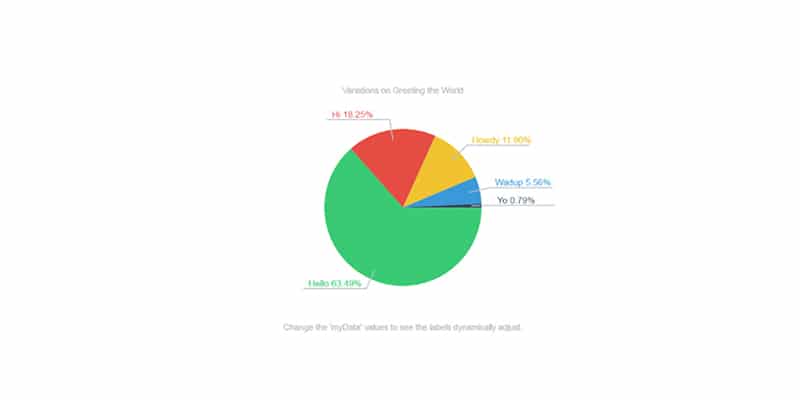
This is another JS pie chart, with an improved code that you can learn from! This pie chart looks great and it will present data in an effective way.
Simple AngularJS Graph
Angular Js is a nice tool that can be used when coding graphs. It is the perfect tool for visualizing data and this amazing graph is the proof. Using Angular data values in inline style allows you to create bar charts, graphs or pie charts easily. Don’t waste any more time and learn how to use this awesome tool!
Triple Doughnut Chart
Data visualising has just become easier with this example! You can now easily create this brilliant triple doughnut chart with multiple colors, using HTML, CSS and some JS as well.
3D Animation Chart Bar
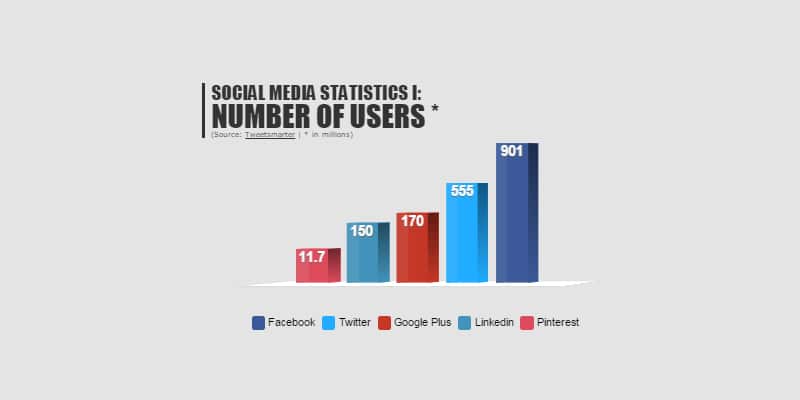
Create awesome statistics charts and graphs, by learning how to make this 3D animation chart bar.
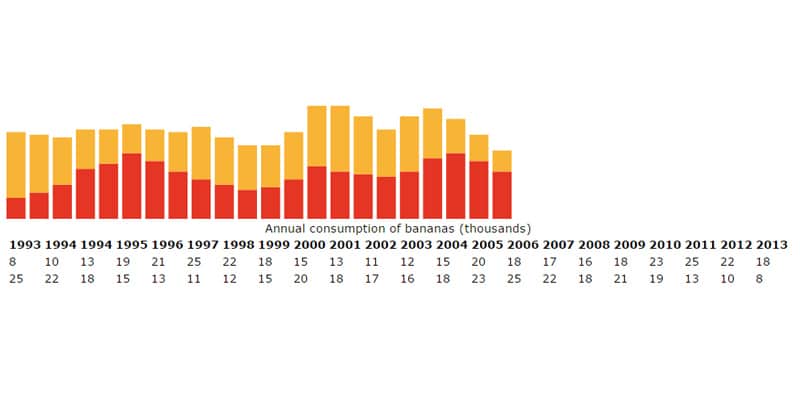
Animated Data Bar Chart & Graph
This is animated data bar chart and graph that you will surely love using in your own projects. It was built using CSS and jQuery and the code is provided in the link above.
HTML 5 Canvas Polar Clock
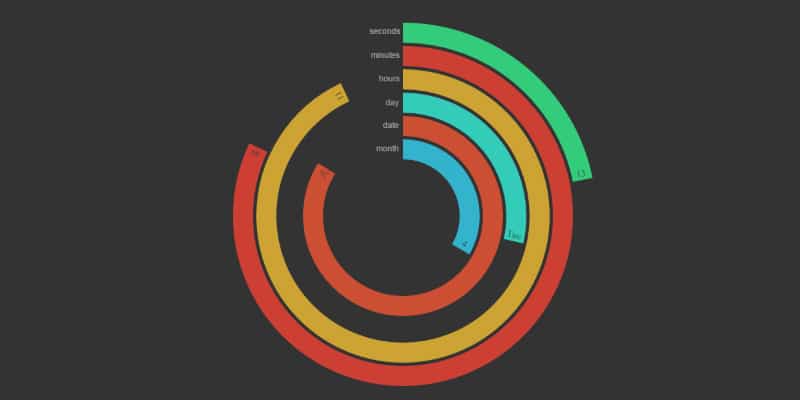
Create a simple HTML 5 canvas polar clock, with subtle animations, by checking out this code.
Country Bar Chart 3D
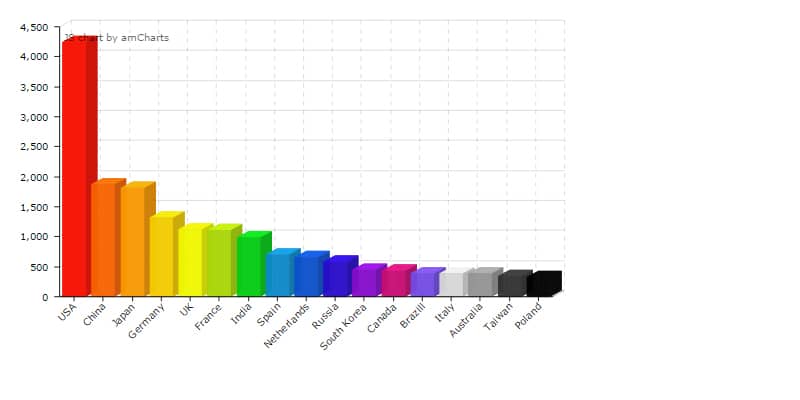
This is a pretty basic country bar chart made in 3D, using HTML, CSS and some JS.
Playing with Google Charts
Learn how to play with Google charts and create awesome CSS jQuery charts yourself.
jQuery Donut Chart Widget
Create awesome jQuery donut charts widgets with this cool coded tutorial. See how they were coded and learn how to make them yourself!
Animated 3D Bar charts
From this tutorial, you will learn to create semi-transparent animated 3D bar charts by following the codes provided here.
